Grade 3 · Unit 9: Data representation and interpretation
Interpreting data
What does the data tell us?
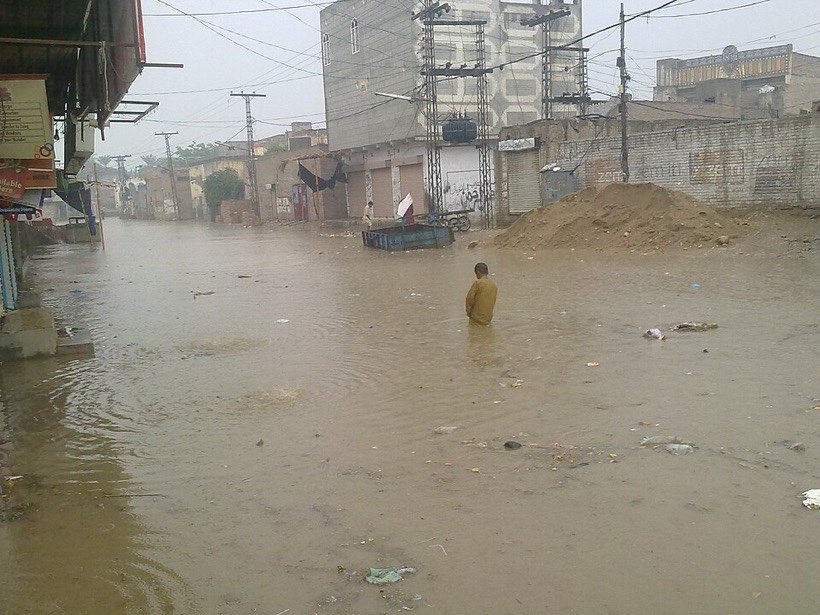
Monsoon rainfall
Weather stations record rainfall each month. We can interpret the data to understand the seasons. Graphs help us see patterns.
Reading a graph
July has the most rain: about 33 cm. January has the least: about 1 cm. Rain rises from March and falls after September.
Comparing
How much more rain in July than January? 32 cm. Which months are wetter than 25 cm? May, July, September. We can compare by subtracting.
Drawing conclusions
A conclusion must come from the data. The data shows most rain falls from May to September. This is the monsoon.
The mode
The mode is the value that appears most often. Here the mode is 4 people. Compare two classes: does the other class have the same mode?
What I learnt
- I can read values from graphs.
- I can compare data.
- I can draw conclusions from evidence.