Grade 1 · Unit 8: Data representation and interpretation
Interpreting data
Read a graph to answer questions.
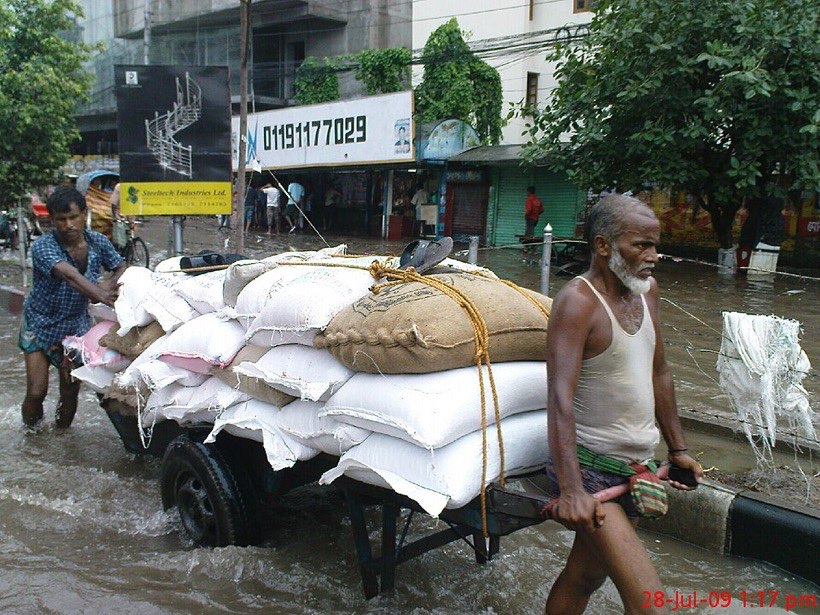
Weather watch
A class counted the rainy days each week in the monsoon. They made a graph. Now they can interpret it – work out what it tells them.
Reading the graph
Week 3 had the most rainy days: 7. Week 1 had the least: 3. Read the number at the top of each bar.
Comparing bars
How many more rainy days in Week 3 than Week 1? 7 − 3 = 4. We can compare bars by finding the difference.
Asking good questions
Look at this pictograph about getting to school. How many children walk? How many come by rickshaw? What else can you find out?
What I learnt
- I can read data from a graph.
- I can use most, least and how many more.