Grade 1 · Unit 8: Data representation and interpretation
Sorting with diagrams
Venn and Carroll diagrams help us sort.
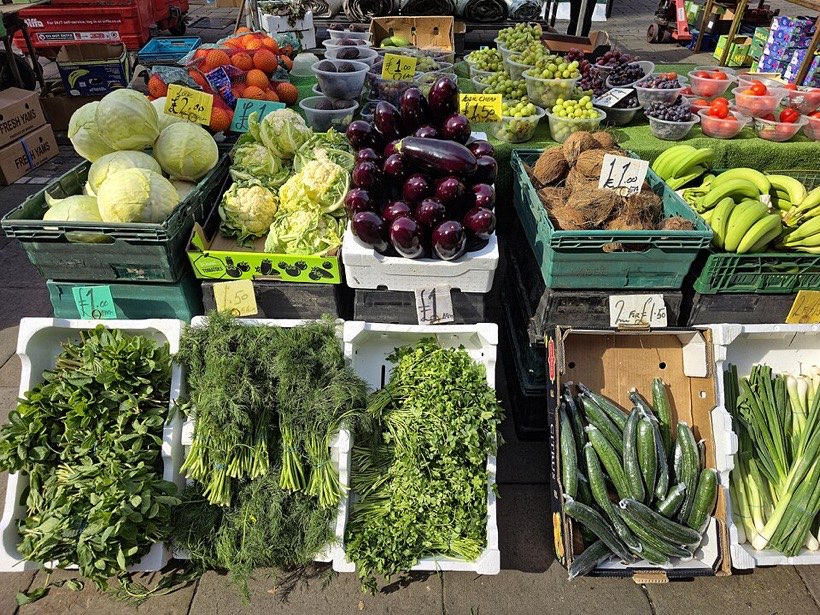
Sorting at the stall
Sellers sort fruit and vegetables into groups. Sorting helps us find and count things. First we choose a rule.
A list and a table
The rule is: fruit or vegetable? Each thing goes in one list. Now we can count each group.
Venn diagrams
A Venn diagram has circles. An apple is red and round, so it goes in the middle. A chilli is red but not round.
Carroll diagrams
A Carroll diagram is a table. A frog has legs and lives in water. A snake has no legs and lives on land.
Ask, collect, sort, show
We can find out about ourselves by asking, counting or watching. Then we sort the answers. Choose a graph or diagram that shows the answer clearly.
What I learnt
- I can sort things by a rule.
- I can use Venn and Carroll diagrams.
- I can choose a way to show my data.