Grade 2 · Unit 8: Data representation and interpretation
Collecting data
Ask a good question.
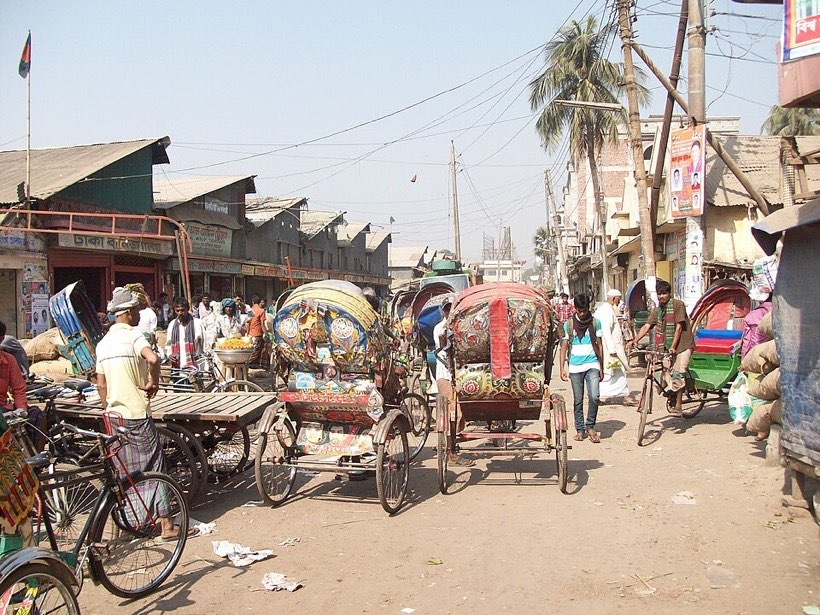
Counting traffic
How many rickshaws pass the school gate? We can count and record data. Good data helps answer questions.
A tally chart
Make one tally mark for each vehicle. Group the marks in fives. The total for each is the frequency.
Good survey questions
A good survey question is clear. Give a small number of choices. Everyone should be able to answer.
Planning a survey
Plan before you collect. Decide who to ask. Check your tallies add up.
What I learnt
- I can plan a survey.
- I can collect data in a tally chart.