Grade 4 · Unit 9: Data representation and interpretation
Collecting data
Plan, collect and organise.
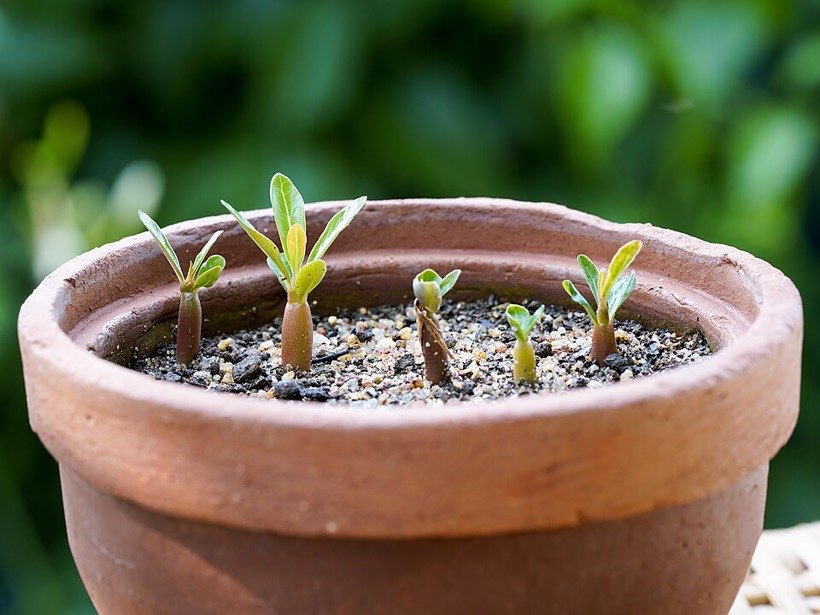
A science investigation
Does sunlight help bean plants grow taller? An investigation collects data to answer this. Planning makes the data reliable.
Discrete or continuous?
Discrete data is counted: whole numbers. Continuous data is measured: it can be any value. This changes which graph we use.
Grouping data
When data has many values, make grouped data. Groups must not overlap. Every value must fit in a group.
Planning
Decide exactly what to measure. Choose a fair and big enough sample. Design a table before collecting.
Using a database
A database stores data in rows and columns. We can sort it (tallest first) or search it (who walks?). Sort data into categories that answer your question, and use tree, Venn or Carroll diagrams for subsets.
What I learnt
- I can plan an investigation.
- I know discrete and continuous data.
- I can group data.